HuBMAP RNAseq
Last Updated 6/23/2020
Overview
This document details bulk and single-cell RNA-sequence assays, data states, metadata fields, file structure, QA/QC thresholds, and data processing.
Much of this document was created utilizing Guidelines for reporting single-cell RNA-Seq experiments

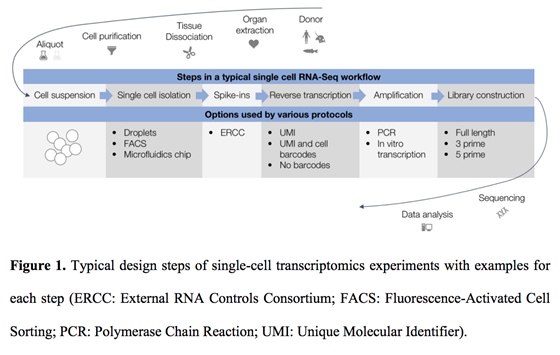
Figure 1: General workflow for single cell transcriptomics (Füllgrabe et al, 2019).
Description
While bulk RNAseq elucidates the average gene expression profile in cells comprising a tissue sample, single-cell RNAseq, employs per-cell and per-molecule barcoding to enable single-cell resolution of the gene expression profile. The RNAseq assay itself is the same for bulk and single-cell templates.
Definitions
RNA sequencing reveals the identities and quantities of transcribed genes in a biological sample. Evaluation of the total gene expression profile of a biological sample is referred to as “transcriptomics”. Genes are transcribed in response to some signal(s) that the gene products (proteins) are required. Each transcribed RNA transcript then undergoes processing (addition of a poly-A tail, 5’-capping, exon splicing) to generate messenger RNA (mRNA), which is exported from the nucleus to the cytoplasm for translation into the corresponding encoded protein. The derived sequences of each mRNA transcript are aligned against a reference genome to establish the identity of the corresponding gene. Since each mRNA molecule represents a single gene transcript, the total mRNA count aligning to a gene represents the expression profile for that gene.
Gene expression profiling begins with isolation of total RNA from a tissue sample or from individual cells. mRNA is typically purified from total RNA by removal of ribosomal RNA (rRNA). mRNA is further processed for sequencing, as described in a detailed example protocol found in Appendix 1 of this document.
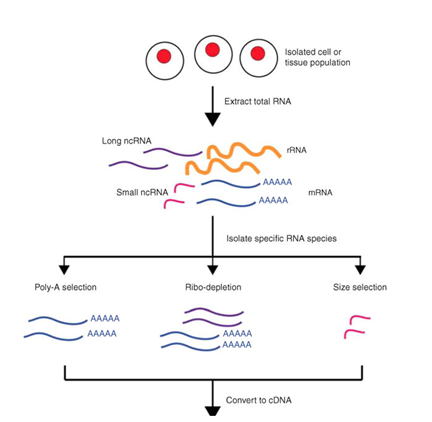
A visual summary is provided below.

Figure 2: A basic representation of the major steps and considerations in the sequencing of RNA. (Kukurba et al, 2015)
Bulk RNAseq
For questions on bulk RNAseq, contact: Stephanie Nevins
10x Genomics single cell RNASeq
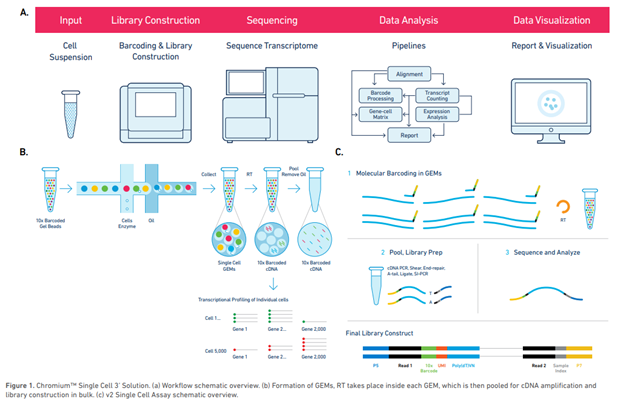
Utilizes a droplet-based emulsion PCR method to encapsulate individual cells with enzyme-containing beads in oil droplets, tagging single cell transcriptomes with UMIs and unique cell barcodes via reverse transcription to cDNA. Tagged transcriptomes are subsequently amplified, sheared to appropriate fragment size, repaired, and ligated with sequencing adapters (illumina) and user-chosen sample index oligos.
- For questions, contact: Maigan Brusko

Figure 3: Single cell workflow (Image from Roy J. Carver Biotechnology Center).
SNARE-Seq
Accessible chromatin in permeabilized nuclei is captured by Tn5 transposase, before droplet generation (DropSeq). Without heating or detergent treatment, binding of transposase to its DNA substrate after transposition maintains contiguity of the original DNA strands, allowing for the co-packaging of accessible genomic sites and mRNA from individual nuclei in the same droplets. A splint oligonucleotide with sequence complementary to the adaptor sequence inserted by transposition (5′ end) and the poly(A) bases (3′ end) allows capture by oligo(dT)-bearing barcoded beads. After encapsulation of nuclei, mRNAs and fragmented chromatin can be released by heating the droplets, allowing access to splint oligonucleotides and adaptor-coated beads with a shared cellular barcode for library construction.
- For questions about SNARE-RNAseq, contact: Blue Lake
 Figure 4: General workflow for linked single-nucleus transcriptome and chromatin accessibility sequencing of human cell mixtures. a, Workflow of SNARE-seq. b, Aggregate single-nucleus chromatin accessibility profiles. c, t-SNE visualization of SNARE-seq paired gene expression (upper panel) and chromatin accessibility (lower panel, n=1,047) data from BJ, GM12878, H1 and K562 cell mixture. d, Inter-assay identity agreement reveals consistent linked transcriptome and chromatin accessibility profiles of SNARE-seq data. (Chen et al., 2019).
sci-RNASeq
Cells are fixed and permeabilized with methanol (alternatively, cells are lysed and nuclei are recovered), then distributed across 96- or 384-well plates. (ii) A first molecular index is introduced to the mRNA of cells within each well, with in situ reverse transcription (RT) incorporating a barcode-bearing, wellspecific polythymidine primer containing unique molecular identifiers (UMIs). (iii) All cells are pooled and redistributed by fluorescence-activated cell sorting (FACS) to 96- or 384-well plates in limiting numbers (e.g., 10 to 100 per well). Cells are gated on the basis of DAPI (4′,6-diamidino2-phenylindole) staining to discriminate single cells from doublets during sorting. (iv) Second strand synthesis, transposition with transposon 5 (Tn5) transposase, lysis, and polymerase chain reaction (PCR) amplification are performed. The PCR primers target the barcoded polythymidine primer on one end and the Tn5 adaptor insertion on the other end, so that resulting PCR amplicons preferentially capture the 3′ ends of transcripts. These primers introduce a second barcode that is specific to each well of the PCR plate. (v) Amplicons are pooled and subjected to massively parallel sequencing, resulting in 3′-tag digital gene expression profiles, with each read associated with two barcodes corresponding to the first and second rounds of cellular indexing. In a variant of the method described below, we introduce a third round of cellular indexing during Tn5 transposition of double-stranded cDNA. Most cells pass through a unique combination of wells, resulting in a unique combination of barcodes for each cell that tags its transcripts. The rate of two or more cells receiving the same combination of barcodes can be tuned by adjusting how many cells are distributed to the second set of wells. Increasing the number of barcodes used during each round of indexing boosts the number of cells that can be profiled while reducing the effective cost per cell. Additional levels of indexing can potentially offer even greater complexity and lower costs. Multiple samples (e.g., from different cell populations, tissues, individuals, time points, perturbations, or replicates) can be concurrently processed in one experiment, using different subsets of wells for each sample during the first round of indexing.
- For questions about sciRNAseq, contact: Dana L Jackson
- For questions about snRNAseq, contact: Stephanie Nevins

Figure 5: Workflow for single cell indexing-RNAseq (sciRNAseq) (Figure provided by the Trapnell Lab).
HuBMAP RNA-Seq Data States
| Data State | Description | Example File Type | |—|—|—| | 0 | Raw data: This is the raw sequence data (unprocessed) generated directly by the sequence instrument in files either with Phred quality scores (fastq)| FASTQ| | 1 | Aligned data: SAM files contain sequence data that has been aligned to a reference genome and includes chromosome coordinates. BAM files are compressed binary versions of SAM files. | SAM, BAM|
HuBMAP Metadata
Definition of Metadata Levels
-
Level 1: These are attributes that are common to all assays, for example, the type (“CODEX”) and category of assay (“imaging”), a timestamp, and the name of the person who executed the assay.
-
Level 2: These are attributes that are common to a category of HuBMAP assays, i.e. imaging, sequencing, or mass spectrometry. For example, for imaging assays this includes fields such as x resolution and y resolution.
-
Level 3: These are attributes that are specific to the type of assay, for example for CODEX that would include number of antibodies and number of cycles.
-
Level 4: This is information that might be unique to a lab or is not required for reproducibility or is otherwise not relevant for outside groups. This information is submitted in the form of a single file, a ZIP archive containing multiple files, or a directory of files. There is no formatting requirement (although formats readable with common tools such as text editors are preferable over proprietary binary formats).
Single Cell - specific Metadata Fields
This metadata field schema now resides in Github where it can be viewed and downloaded.
Bulk RNA seq - specific Metadata Fields
This metadata field schema now resides in Github for download.
HuBMAP Single-cell Sequence Raw File Structure
The raw sequencing data is recorded in a FASTQ file which contains sequenced reads and corresponding sequencing quality information. Every read in FASTQ format is stored in four lines as follows
@HWI-ST1276:71:C1162ACXX:1:1101:1208:2458 1:N:0:CGATGT
NAAGAACACGTTCGGTCACCTCAGCACACTTGTGAATGTCATGGGATCCAT
+
#55???BBBBB?BA@DEEFFCFFHHFFCFFHHHHHHHFAE0ECFFD/AEHH
Line 1 begins with a ‘@’ character and is followed by a sequence identifier and an optional description (such as a FASTA title line).
Line 2 is the sequence of the read.
Line 3 begins with a ‘+’ character and is optionally followed by the same sequence identifier (and any description) again.
Line 4 encodes the quality values for the bases in Line 2.
HuBMAP QA/QC of raw (state0) data files
The bolded steps below constitute a series of standard RNA-seq data analysis workflow.
Pre-alignment QC with FastQC:
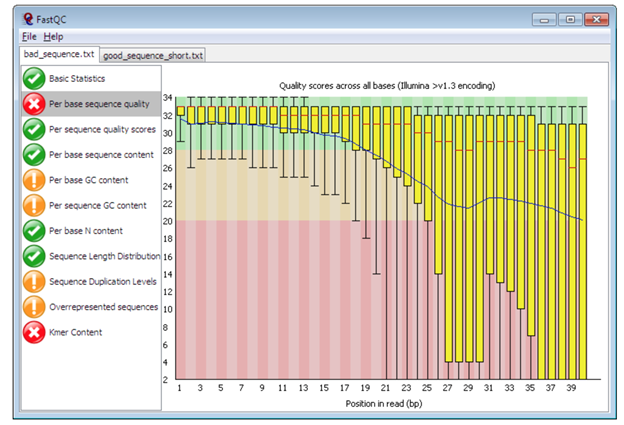
 Figure 6: Plot of per sequence base quality (Figure from Babraham Bioinformatics)
| qc_metric | Threshold | Tool |
|---|---|---|
| average_base_quality_scores | >20 (accuracy rate 99%) | FastQC |
| gc_content | FastQC | |
| sequence_length_distribution | >45 (encode) | FastQC |
| sequence_duplication | FastQC | |
| k-mer_overrepresentation | 20 (accuracy rate 99%) | |
| 0 | >20 (accuracy rate 99%) | FastQC |
| contamination_of_primers_and_adapters_in_sequencing_data | Library specific data on adapters need to be provided to the read-trimming tool like trimmomatic (Bioinformatics. 2014 Aug 1; 30(15):2114-20.). |
Definition
Base quality scores: prediction of the probability of an error in base calling
GC content: Percentage of bases that are either guanine (G) or cytosine (C)
K-mer overrepresentation
Overrepresented k-mer sequences in a sequencing library
Library-level Alignment QC
Note that this is not per-cell. Trimmed reads are mapped to reference genome.
| qc_metric | Threshold | Method |
|---|---|---|
| unique_mapping_percent | Ideally > 95% (Encode) Acceptable > 80% (at least for bulk) | SAMtools/Picard |
| duplicate_reads_percent | SAMtools/Picard | |
| fragment_length_distribution | >45 (encode) | SAMtools/Picard |
| gc_bias | Biased if variance of GC content is larger than 95% of confidence threshold of the baseline variance | SAMtools/Picard |
| library_complexity | NRF>0.9, PBC1>0.9, and PBC2>3 | https://www.encodeproject.org/data-standards/terms/#library |
Uniquely mapping % –
Percentage of reads that map to exactly one location within the reference genome.
Duplicated reads % -
Percentage of reads that map to the same genomic position and have the same unique molecular identifier (Encode)
Post-alignment processing QC:
(see Per cell QC metrics table below)
-
Remove duplicated reads
-
Remove low quality reads
-
Remove mtDNA reads
Appendix 1. Brief detailed description of the bulk RNAseq assay.
The protocol from NEB is summarized as follows and can be found here (NEBNext® UltraTM RNA Library Prep Kit #E7530S/L, Version 10.0_4/20). Briefly, using rRNA-depleted mRNA, first perform RNA fragmentation followed by primer addition and first strand cDNA synthesis. Next perform second strand cDNA synthesis and bead purify with AMPure XP beads. Perform end-prep, adapter ligation and another bead purification. Depending on the number of samples being prepared, it will be important to use either singleplex or multiplex oligos in the PCR enrichment steps for downstream sample demultiplexing. Then, finally bead purify once more and check the quality of the library by observing the library size distribution on a Bioanalyzer. The average size should be around 300 bp.
The detailed assay protocol can be found here: dx.doi.org/10.17504/protocols.io.bftnjnme
For Additional Help
Please contact: Maigan Brusko
Processing
HuBMAP RNA-seq datasets are processed with a standardized pipeline based on the Salmon quantification method, followed by Scanpy and scVelo.
Expression matrices are stored in the AnnData format, serialized as HDF5 and converted to Zarr for visualization in the HuBMAP portal.
Figure 6: AnnData in-memory layout
Quantification is performed using the GRCh38 human reference transcriptome, with an index including separate intronic and exonic sequences, and genes keyed by Ensembl IDs. Three H5AD files may be of interest to users:
-
expr.h5ad: Adjusted version ofraw_expr.h5adwith genes keyed by versioned Ensembl IDs, with separateAnnDatalayersspliced,unspliced, andspliced_unspliced_sumfor exonic, intronic, and the sum of those counts, respectively.Note that Salmon writes fractional counts for reads that map equally well to multiple transcript sequences; this count matrix and the following
expr.h5adare not necessarily integer-valued. secondary_analysis.h5ad: contains filtered and normalized expression data, with annotations for each cell (entry inAnnData.obs) such as Leiden cluster assignment, UMAP coordinates, etc.scvelo_annotated.h5ad: contains RNA velocity estimation from the scVelo package, typically as entries inAnnData.obsm.
(A file raw_expr.h5ad is also provided, containing the quantification output
from Salmon directly converted to H5AD without further adjustment or processing.
Genes (entries in AnnData.var) are keyed by versioned Ensembl IDs for exonic
sequences, and versioned Ensembl IDs with a “-I” suffix for intronic sequences.)

